
Office Space Demand Forecast, Second Quarter 2026
Release Date: May 2026
Office Market Fundamentals Improve Despite Slowing Economy
The U.S. office market has recorded three consecutive quarters of positive net absorption through the first quarter of 2026, marking the longest sustained period of demand growth since mid-2022, when rising interest rates disrupted leasing activity. However, momentum slowed materially in the most recent quarter. After 9.5 million square feet of positive net absorption in the fourth quarter of 2025, the office market experienced only 2.9 million square feet of absorption in the first quarter of 2026.
At the same time, the amount of office space removed from inventory through demolitions or conversions exceeded space delivered through new construction by 3.0 million square feet in the first quarter, only the second time this has occurred in CoStar Group’s dataset going back to 2008. Combined with modest positive absorption over the last two quarters, the recent decrease in inventory has resulted in vacancy rates declining to 11.8% in the first quarter of 2026, down from 11.9% in the third quarter of 2025.
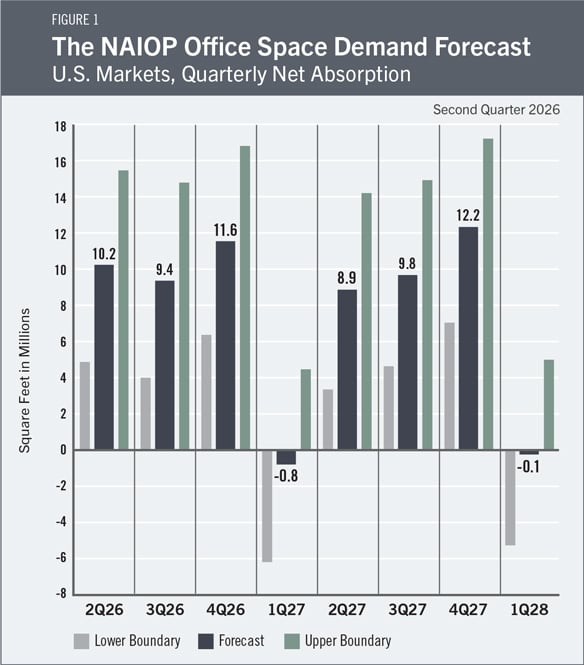
Given the deceleration in economic growth and job creation and the recent slowdown in the office market recovery, net office space absorption over the last three quarters of 2026 is expected to total 31.2 million square feet, with another 30.1 million square feet of positive absorption in 2027. The current forecast assumes a 22.5% chance of a recession, in which case absorption will be lower than forecast.
The Office Market
Since the second quarter of 2024, the national office market has exhibited remarkably little net change in aggregate demand. Over the past eight quarters, quarterly net absorption has averaged negative 121,531 square feet nationwide, an amount smaller than a typical suburban office building. Cumulatively, the U.S. office market has shed only 972,248 square feet of space during this period, a negligible figure relative to the overall inventory. This period of flat demand contrasts with volatility in the broader economy and reflects how small gains in office use have been offset by tenants continuing to reduce their space.
Recent office market conditions point to limited new development and highly selective leasing. Commercial real estate services firms report that demand remains focused on higher-quality buildings, particularly in urban cores, where large tenants in tech and finance continue to anchor activity and support preleasing. New supply remains constrained by elevated construction costs and cautious capital markets, while sublease availability has continued to decline as occupiers reassess longer-term space needs. Overall, conditions point to gradual stabilization, with performance varying widely across markets and building types.
Economic Factors
U.S. economic data present a mixed picture, as ongoing expansion is tempered by slowing momentum and elevated uncertainty. Real gross domestic product grew at an annualized rate of 2.0% in the first quarter of 2026.1 Equity markets have continued to reach new highs, reflecting investor confidence in corporate earnings and expectations for ongoing growth. Consumer spending also remains resilient, with retail sales reaching new nominal highs.2 The unemployment rate remains relatively low at 4.3%.3 Collectively, these indicators point to an economy that is still expanding, though at a slower and more uneven pace than in prior years.
At the same time, several measures suggest emerging sources of caution. Inflation pressures remain elevated. As of April, the Consumer Price Index had increased 3.8% over the past 12 months, constraining household purchasing power.4 The University of Michigan’s Index of Consumer Sentiment fell to 48.2 in May, the lowest reading in the survey’s history.5 Elevated prices, borrowing costs that remain significantly higher than in mid-2022, and heightened geopolitical tensions appear to be weighing heavily on household confidence. This divergence between continued consumer spending and deeply pessimistic sentiment adds uncertainty to the outlook and complicates assessments of how economic conditions may translate into business investment and demand for office space in the coming quarters.
Finally, uncertainty related to artificial intelligence continues to influence the broader economic outlook, despite limited evidence of near-term effects beyond increased capital spending on data centers. In the first half of 2026, concerns about potential job losses in knowledge-based industries—exemplified by a Citrini Research thought experiment6—contributed to a more cautious business environment. However, current employment data do not show a material impact to date, even as firms continue to evaluate how AI may affect their operations and workforce needs.
The Forecast Model
The model that informs this forecast draws from historical data on the economy and office real estate absorption to project future demand. Recent trends in office absorption suggest office sector performance will reflect economic conditions, as in past economic cycles. The baseline out-of-sample forecast is illustrated in Figure 1.
Global economic uncertainty from events like the closure of the Strait of Hormuz and broader consequences of the conflict with Iran contribute to the possibility that the economy will enter a recession this year. Table 1 illustrates the baseline out-of-sample forecast and the expected range of net office absorption under a scenario in which a recession begins in the second quarter of 2026. The baseline forecast assigns these values a 22.5% weighting. Table 2 assumes that the economy does not enter a recession, and the baseline forecast assigns these values a 77.5% weighting. If a recession does occur, actual net absorption is expected to be lower. If a recession does not occur, absorption is expected to be higher than the current forecast.
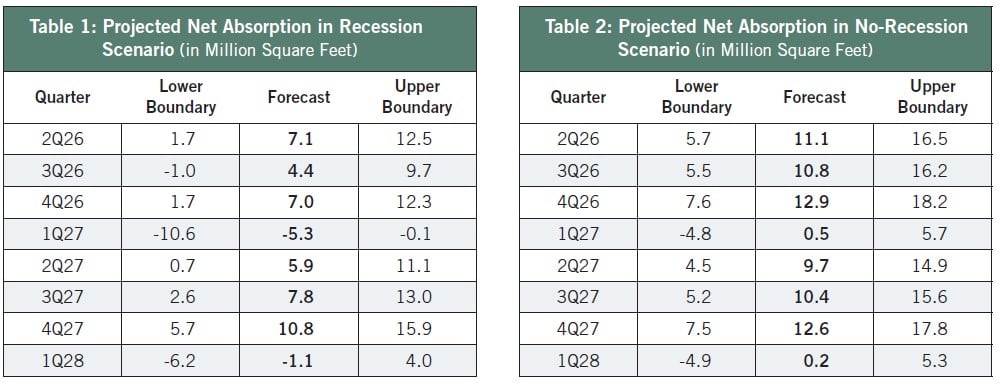
Under the no-recession scenario, the forecast projects average net absorption of approximately 8.5 million square feet per quarter over the next eight quarters. If a recession were to emerge in mid-2026, modeled absorption would decline to roughly 4.6 million square feet per quarter.
Actual Versus Forecast
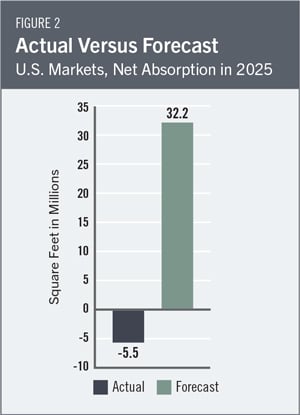
Figure 2 compares forecast net absorption for 2025 with actual outcomes based on CoStar Group data. The forecast projected total net absorption of approximately 32.2 million square feet for the year, compared with an actual decline of approximately 5.5 million square feet. More than half (20.9 million square feet) of the difference between actual versus forecast values is from the second quarter 2025 forecast. That forecast was based on data that at the time reported cumulative positive net absorption of 12.9 million square feet in the fourth quarter of 2024 and the first quarter of 2025. The most recent absorption data for these two quarters has been revised lower by 20.1 million square feet. Had the data available for the second quarter 2025 forecast matched current values, the forecast values would have been lower and closer to the actual values.
Key Inputs and Disclaimers
In January 2016, the CREDA Research Foundation published “Forecasting Office Space Demand,” a model that forecasts net absorption of U.S. office space on a quarterly basis for eight consecutive quarters. Created by researchers Hany Guirguis, Ph.D., of Manhattan University, and Joshua Harris, Ph.D., CRE, CAIA, of Fordham University, the model is similar to that used for the CREDA Industrial Space Demand Forecast, which successfully projected a drop and rebound in net absorption of industrial space in 2009 and 2010. (The industrial space demand model was created by Guirguis along with Randy Anderson, Ph.D., then at the University of Central Florida.) Below are the leading, coincident and lagging variables used in the office space demand forecast.
- The growth rate in real gross domestic product captures the broadest level of macroeconomic activity, reflecting the value of all goods and services produced each year.
- Corporate profits of domestic industries directly capture the financial capacity and growth of firms that may need to expand. Profits are a source of retained earnings, so they indicate how much money is available to fund investments in plants and equipment, an investment activity that raises productive capacity.
- Total employment in the financial services sector is a direct measure and proxy for office-using employment that best fits with changes in office space demand.
- Two variables from the Institute for Supply Management’s Non-Manufacturing Indices serve as proxies for a sentiment measure on the future health of office-using firms. The ISM-NM Inventories Index measures increases and decreases in inventory levels, while the ISM-NM Supplier Deliveries Index measures how long it takes suppliers to deliver parts and materials that are integral to service-sector businesses.
- Core Personal Consumption Expenditures Price Index Inflation Rate (PCE Inflation).
These five measures make possible an accurate two-year forecast for nationwide net absorption of office space. The methods used in the forecast are dynamic rather than static to account for the changing nature of the underlying macroeconomy. Historical office real estate market data are provided by CoStar Group, which assumes no responsibility for this forecast. The dataset used for the forecast includes all office properties in the 390 largest U.S. markets tracked by CoStar Group, regardless of property size or owner occupancy status. Net absorption and other real estate market data identified in this report may vary compared to different datasets.
Authors
Hany Guirguis, Ph.D., Dean, O’Malley School of Business and Professor, Economics and Finance, Manhattan University
Joshua Harris, Ph.D., CRE, CAIA, Executive Director, Fordham Real Estate Institute, Fordham University
Media Inquiries
Please contact Brielle Scott, director of marketing and communications, at bscott@CREDAglobal.org.
1 U.S. Bureau of Economic Analysis, “GDP (Advance Estimate), 1st Quarter 2026,” news release, April 30, 2026, https://www.bea.gov/news/2026/gdp-advance-estimate-1st-quarter-2026.
2 U.S. Census Bureau, “Monthly Retail Trade and Food Services,” accessed May 12, 2026, https://www.census.gov/retail/sales.html.
3 U.S. Bureau of Labor Statistics, “The Employment Situation—April 2026,” Economic News Release, May 8, 2026, https://www.bls.gov/news.release/empsit.nr0.htm.
4 U.S. Bureau of Labor Statistics, “Consumer Price Index—April 2026,” Economic News Release, May 12, 2026, https://www.bls.gov/news.release/cpi.nr0.htm.
5 University of Michigan, Institute for Social Research, Surveys of Consumers, accessed May 12, 2026, https://www.sca.isr.umich.edu/.
6 Citrini and Alap Shah, “The 2028 Global Intelligence Crisis,” Citrini Research, February 22, 2026, https://www.citriniresearch.com/p/2028gic.