
 Search

 Login
Login



The Commercial Real Estate Development Association Market Monitor
Release Date: July 2026
Executive Summary
The Commercial Real Estate Development Association Market Monitor (formerly the NAIOP Market Monitor) provides insights into shifting market conditions and capital flows across the United States. The report’s findings can help investors and developers identify regional trends and markets that align with their risk and return objectives or warrant further examination.
The 2026 Market Monitor identifies consistent, slow growth in sales activity in office markets. It also reveals strong growth in investment activity in the second-largest 51 industrial markets across the U.S.
Notable findings include:
- Overall, the largest 102 office and industrial markets grew in sales activity over the last year, the second consecutive year of growth for both product types.
- Transaction volume in the largest 51 office markets grew faster than in the second-largest 51 markets, while volume in the second-largest industrial markets grew faster than the largest 51 industrial markets.
- More office markets in the Midwest declined in relative size than grew.
- Several industrial markets experienced significant changes in relative transaction volume, particularly among the second-largest 51 markets, where activity is more sensitive to individual transactions.
- Secondary markets around inland logistics hubs appear to have benefited from recent market dynamics, while at least two port markets (Savannah, Georgia, and Norfolk, Virginia) have experienced a significant decline in relative size, likely because of shifting patterns in international trade.
- Relative volatility rose in several Midwestern industrial markets.
About the Commercial Real Estate Development Association Market Monitor
Each year, the Market Monitor examines data provided by CoStar Group to describe the relative size (transaction volume) and volatility (variance in transaction volume and capitalization rates) of the largest 102 office and industrial markets in the U.S. This report looks at data from the second quarter of 2025 through the first quarter of 2026 and identifies notable changes compared with the same period a year earlier. Office and industrial markets are each segmented into the largest 51 and second-largest 51 markets by transaction volume and arranged on a two-dimensional grid with volume on the Y-axis and volatility on the X-axis. The results are displayed in Figures 1 and 2 for office markets and Figures 4 and 5 for industrial markets. Additional information about the methodology used to construct the Market Monitor is included in the Methodology section at the end of this report. An interactive dashboard that accompanies this report visualizes changes over time for individual office and industrial markets and includes maps showing their relative volatility.
Office Markets
Transaction Volume
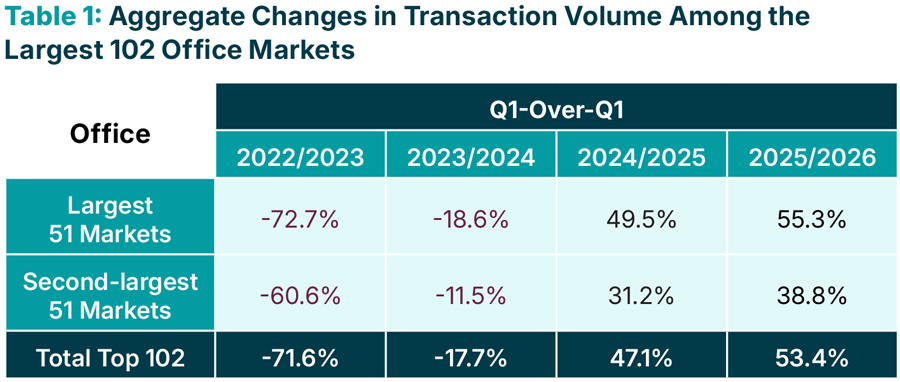
Comparisons are between the largest or second-largest 51 office markets identified for each period. Some markets currently in each group did not meet these criteria in earlier years.
Total transaction volume across the top 102 office markets continues to grow year over year (YOY), although a broader recovery is incomplete. The office sector remains in a transitional phase driven by pricing resets, evolving tenant requirements and uncertainty around long-term space utilization.
Transaction volume grew across most markets, including strong growth in several large markets such as New York, San Francisco, San Jose, Dallas- Fort Worth, Houston, Miami, Boston and Chicago. However, with growth widespread, there were fewer significant changes in the size of individual markets relative to each other when compared with last year’s report.
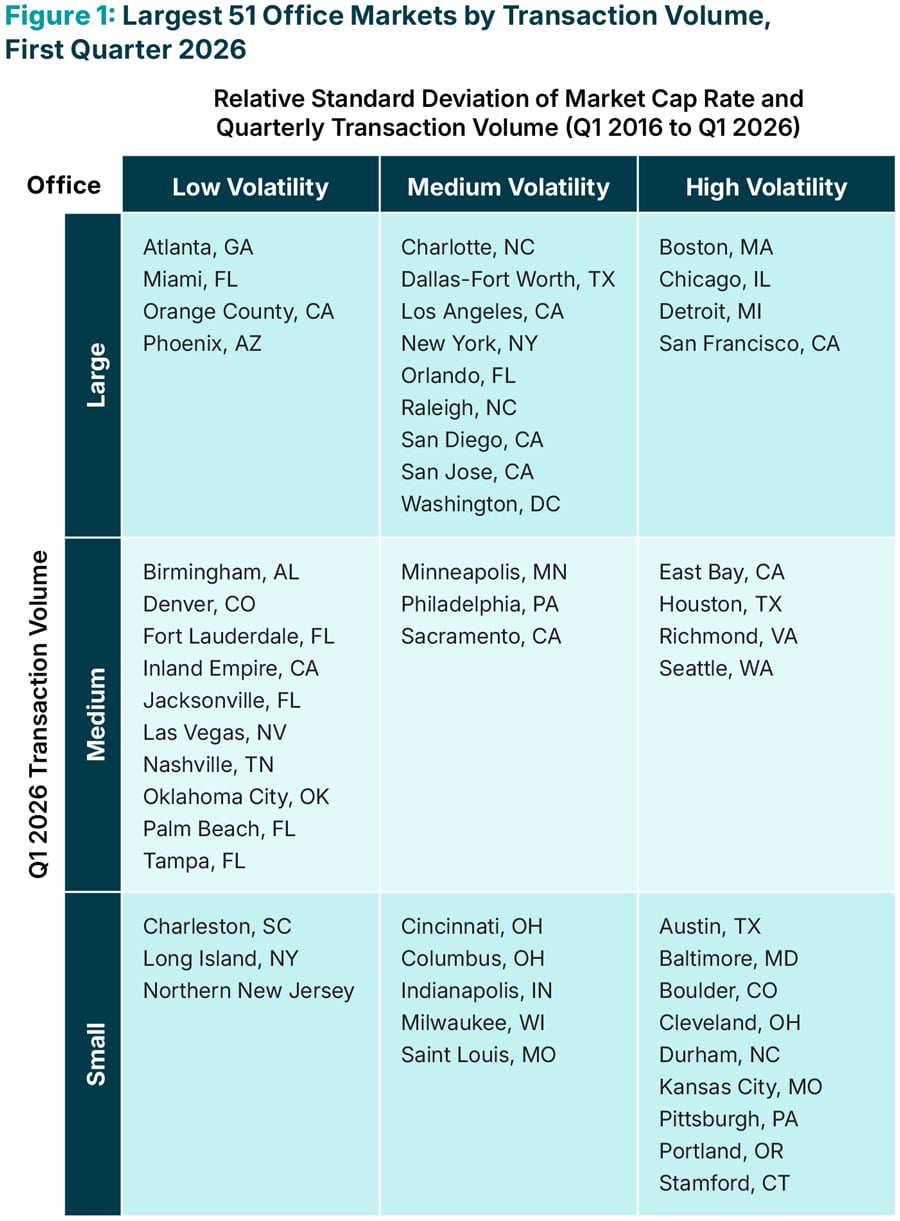
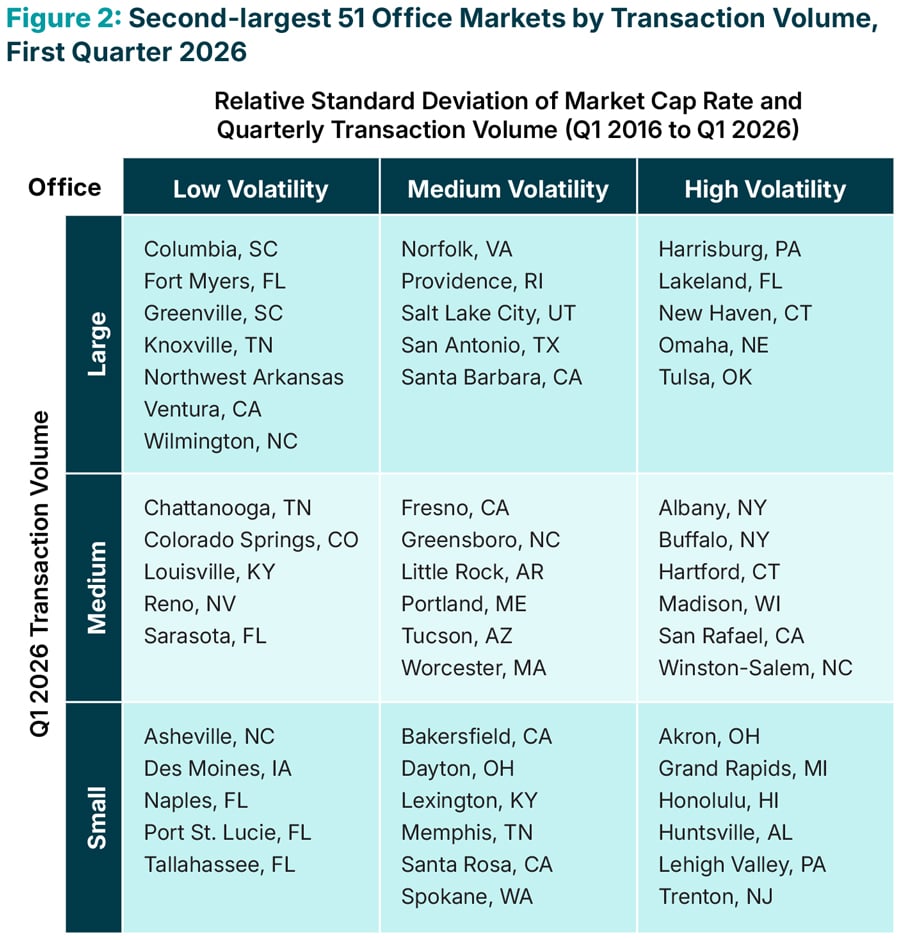
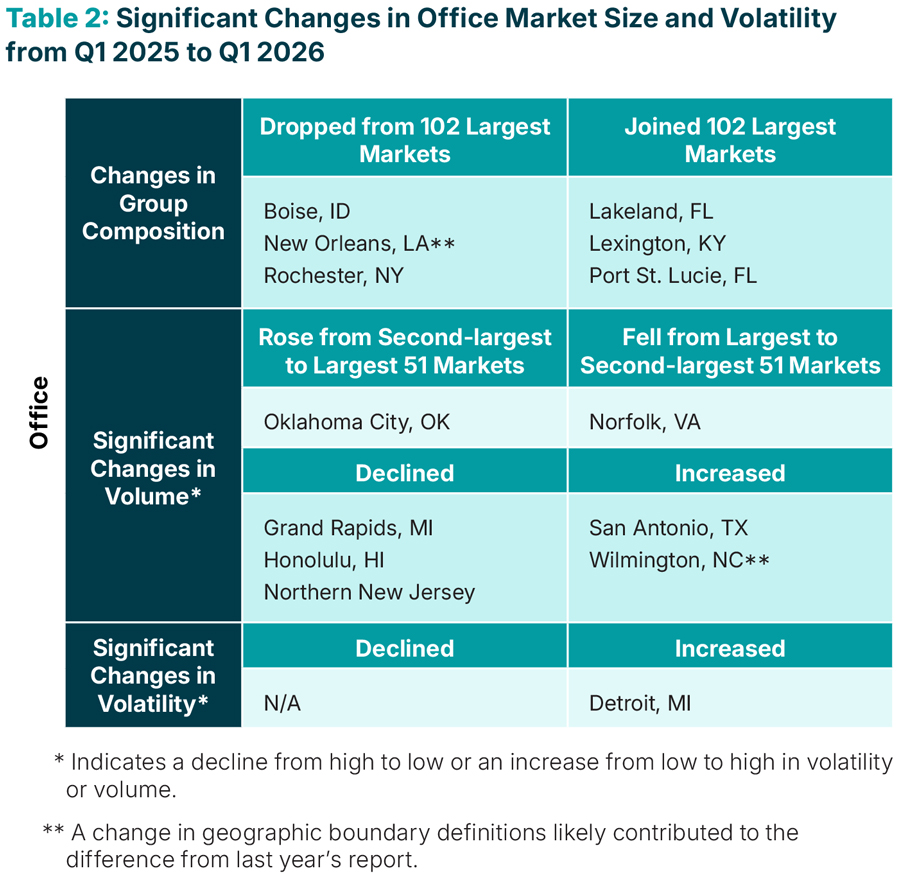
Patterns in transaction volume varied across regions, with capital continuing to flow toward markets where pricing has adjusted, and demand appears more stable. Grand Rapids, Honolulu and Northern New Jersey experienced significant declines in relative size, and San Antonio and Wilmington experienced significant gains. However, the only census region with a notable pattern in transaction volume was the Midwest, where relative size declined in six markets and rose in three (out of 16). Oklahoma City rose from the second-largest group to the largest group of office markets, while Norfolk fell from the largest to the second-largest group. At the same time, Boise, New Orleans and Rochester are no longer among the 102 largest office markets and were replaced by Lakeland, Lexington and Port St. Lucie.
In several secondary markets, a single large transaction or portfolio sale drove YOY changes in transaction volume. This underscores that transaction volume metrics for smaller markets can be extremely volatile, as a major sale (more than $50 million) in one year can skew YoY comparisons. To account for this, the Market Monitor sorts markets into the largest or second-largest 51 markets based on average transaction volume over 10 years, reducing the influence of short-term fluctuations.
This year’s report reflects updated boundaries for core-based statistical areas (CBSAs) as defined by the U.S. Census Bureau. In most markets, the change in office inventory resulting from new boundaries was too small to have an appreciable effect on the market’s relative size as measured by transaction volume. However, changes in inventory due to boundary changes appear to have contributed to the significant increase in Wilmington’s relative size and to New Orleans no longer being categorized in the largest 102 markets.
Volatility
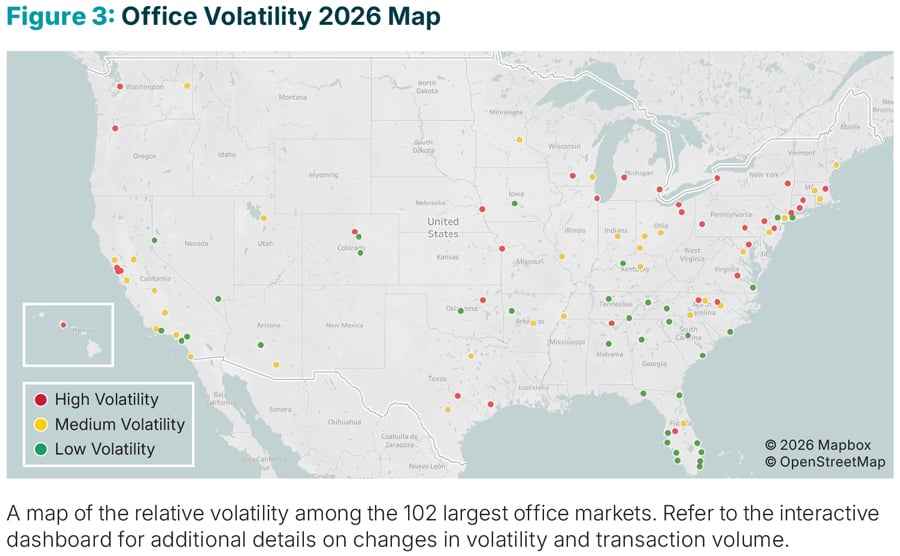
Office market volatility largely stabilized over the past two years following a more active period of repricing observed in 2024’s edition of the Market Monitor. That year, eight markets experienced significant changes in volatility, spread across secondary and smaller markets in multiple regions with no clear geographic concentration. Those movements had quieted considerably by last year’s report and in the current edition. Detroit is the only exception, rising in volatility in last year’s report before returning to prior levels in the current edition. The broader pattern suggests the repricing cycle that had primarily affected smaller office markets has largely run its course. Most markets are holding steady rather than actively shifting in either direction.
Industrial
Transaction Volume
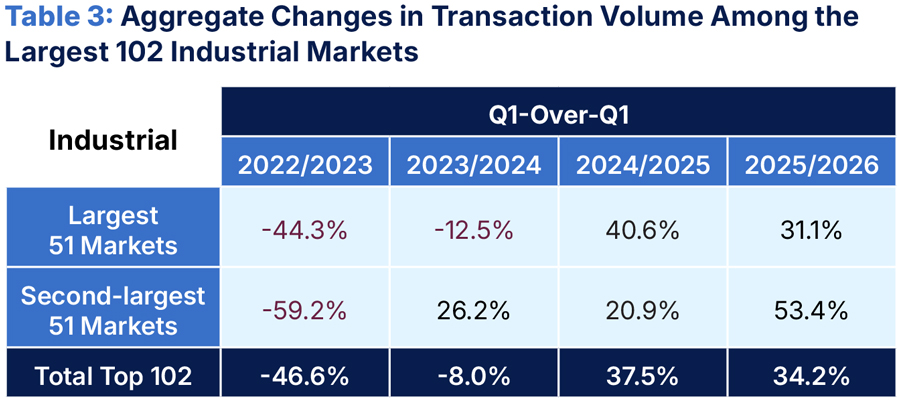
Comparisons are made between the largest or second-largest 51 industrial markets identified for each period. Some markets currently in each group did not meet these criteria in earlier years.
Transaction volume across the 102 largest industrial markets continued to expand YOY, with growth strongest in the second-largest 51 markets. While recent industrial transactions growth is comparable to the rate for office markets, the industrial sector has shifted from an earlier period of rapid expansion to a more disciplined phase defined by absorption of new supply, normalization of tenant demand and greater investor selectivity.
The strong growth in transaction volume across the second-largest industrial markets was concentrated in inland logistics and regional distribution markets such as Greenville and Spartanburg, South Carolina, and Harrisburg, Pennsylvania. These markets continue to benefit from structural demand drivers related to supply chain reconfiguration or population growth, as well as comparatively lower development and operating costs, a notable advantage as costs increase nationwide.
Broader economic and geopolitical factors continue to shape market conditions. Ongoing shifts in global supply chains, energy markets, tariffs and trade policy are affecting demand in logistics-driven markets, with negative consequences for deal volume in markets that are particularly reliant on international trade. For example, the port market of Savannah, Georgia, which in previous years had experienced strong and consistent growth in transaction volume, instead underwent a sharp decline. Similarly, the port market of Norfolk, Virginia, dropped from the largest 51 to the second-largest 51 markets.
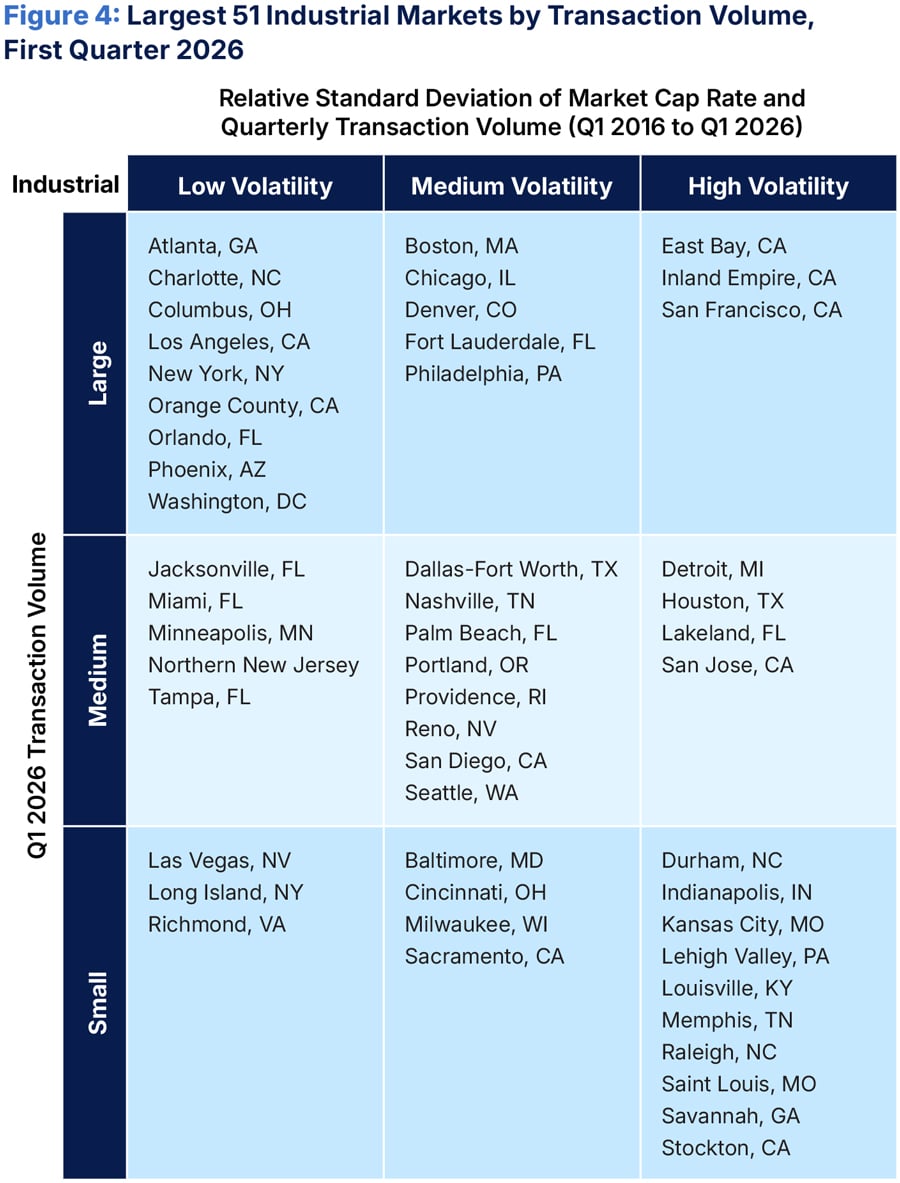
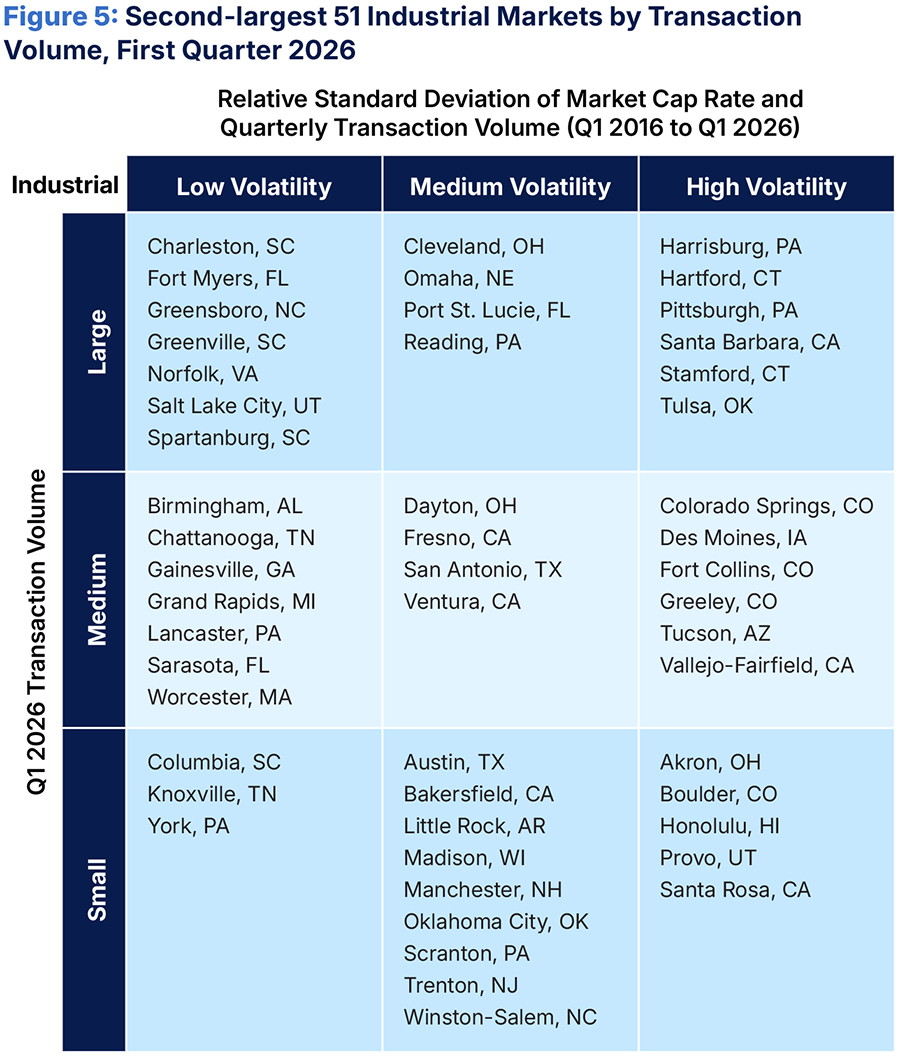
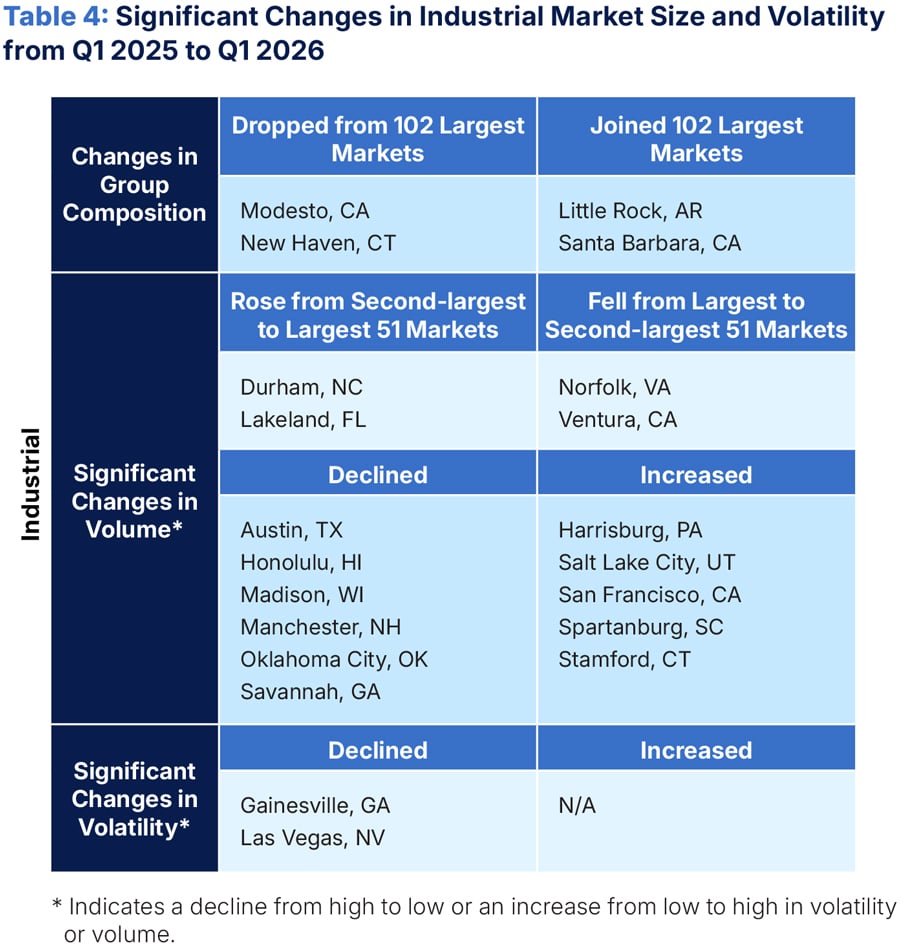
Aside from San Francisco and Savannah, most significant changes in relative transaction volume occurred in the second-largest 51 markets, including Austin, Honolulu, Oklahoma City, Salt Lake City and Stamford. This pattern is consistent with the higher degree of variability typically observed in smaller markets, where transaction volume can be influenced by a limited number of large deals.
Modesto and New Haven dropped out of the top 102 industrial markets, while Little Rock and Santa Barbara entered the second-largest tier following increased transaction activity. Durham and Lakeland rose into the largest 51 markets, while Norfolk and Ventura moved in the opposite direction.
No clear regional patterns emerged in relative market size as measured by transaction volume. Performance continued to vary across individual markets, reflecting localized demand conditions, differences in supply pipelines and the timing of large transactions. Changes in CBSA boundary definitions since the previous report do not appear to have contributed to any of the significant changes in industrial transaction volume noted in this report.
Volatility
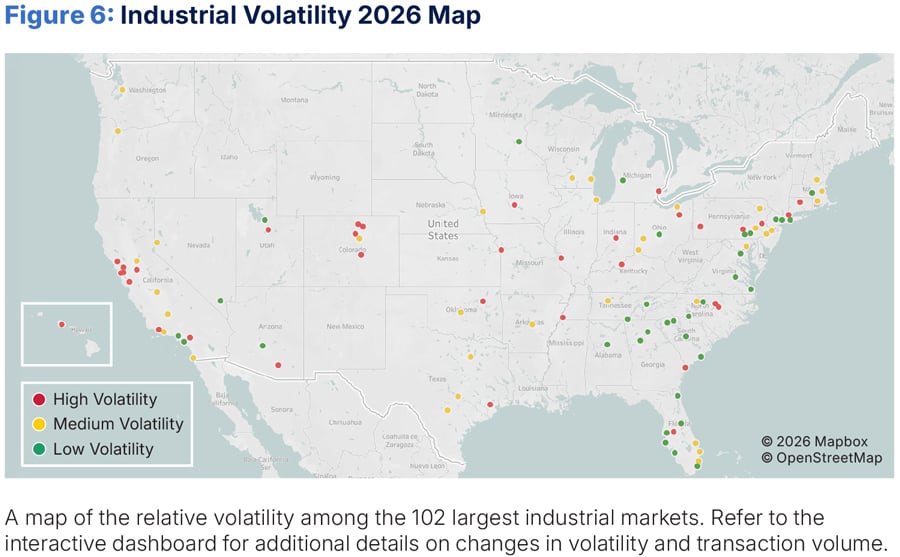
Overall, the industrial sector remains fundamentally stable, with relatively limited movement in market volatility compared to prior periods. Gainesville and Las Vegas were the only markets to undergo a significant change, with volatility declining in both. The Midwest was home to the most notable regional change in volatility, with seven out of 16 markets increasing in relative volatility and none experiencing a decline. Volatility declined in more Southern markets than rose, but the difference was modest considering how many of the largest industrial markets are located in the region (of the 43 markets in the region, volatility declined in eight and rose in four).
The West continues to have the highest concentration of high volatility markets, reflecting the pricing and transaction uncertainty that has persisted following the end of the pandemic-era industrial surge. These markets have carried elevated volatility longer than other regions as cap rates and deal flow work toward a more stable equilibrium.
Methodology
The Commercial Real Estate Development Association Market Monitor analyzes data on transaction volume and capitalization rates provided by CoStar Group. It takes the largest 102 office and industrial markets in the U.S. and sorts them into the largest 51 and next-largest 51 as measured by transaction volume in the most recent quarter. These markets are then arranged in two-dimensional three-by-three grids. The grid’s vertical axis sorts each set of 51 markets into top, middle and bottom thirds for transaction volume as a measurement of market size (large, medium and small). The grid’s horizontal axis sorts these markets by their volatility, measured as an equal weighting of the relative standard deviation of their respective capitalization (or “cap”) rates and the relative standard deviation of their respective quarterly transaction volume over a 10-year period. The bottom, middle and top third of markets are classified as “low volatility,” “medium volatility” and “high volatility.” Relative standard deviation was chosen as the best measurement of volatility, as it accounts for a market’s size (e.g., small changes in transaction volume are more significant in smaller markets) and average cap rate (a small change in cap rate has a greater effect on real values in a market that previously had a low cap rate than it does in a market that had a high cap rate). The resulting grids allow a user to simultaneously compare markets by size and volatility.
The relative volatility between the largest 51 and the next-largest 51 office and industrial markets can be compared on a percentage basis at a point in time. For the purposes of this report, the authors compared the indexed volatilities of each market type in the first quarter of 2026. Some markets are outliers from the group average, so readers should not directly compare volatility for individual markets that appear in the 51 largest office or industrial markets to those that appear in the second largest 51 markets.
About CREDA
The Commercial Real Estate Development Association (CREDA) is the leading global professional organization for the commercial real estate industry, representing more than 21,000 members across 55 chapters in North America. CREDA equips professionals with the resources, relationships and insights needed to advance their careers through high impact networking, practical education and forward-looking research. As a trusted voice at the forefront of the industry, CREDA drives innovation in development by advocating for legislation that supports commercial real estate growth and delivering data-driven insights through the CREDA Research Foundation.
The Commercial Real Estate Development Association Research Foundation was established in 2000 as a 501(c)(3) organization to advance the knowledge of the commercial real estate development industry through objective research, analysis and education. By delivering data-driven insights on the industry’s economic impacts and market dynamics, the Foundation equips industry leaders, policymakers and stakeholders with information they need to make informed decisions and create thriving communities. For more information, visit credaresearch.foundation.
About the Authors
Maria Sicola and Elle Saling have partnered on many data and analytics initiatives, including developing market forecasting models, global data warehousing databases, and benchmarking tools for leasing analysis using evolving data technologies and analytics to support decisionmaking and facilitate public discussion. Charles Warren is the National Practice Leader of Real Estate Economics and Finance Advisory at WSP, focusing on leveraging transit-oriented development to increase funding for transit infrastructure. Sicola holds an MBA from Manhattan University, an MS in Information Science from Rutgers University, and a BA from Seton Hall University; additionally, she completed post-graduate studies in statistics and experimental design at Purdue University. Saling holds an Executive Management Certification from the UCLA Anderson School of Management and a BS in Business Administration from the California Polytechnic University at San Luis Obispo. Warren holds a PhD in City and Regional Planning from the University of California Berkeley and an MA in Urban Studies from the John W. Draper Interdisciplinary Program at New York University.
Media Inquiries
Please contact Brielle Scott, director of marketing and communications, at bscott@credaglobal.org.
Disclaimer
This project is intended to provide information and insights to industry practitioners and does not constitute advice or recommendations. CREDA disclaims any liability for actions taken as a result of this project and its findings.
© 2026 Commercial Real Estate Development Association Research Foundation