
 Search

 Login
Login



Industrial Space Demand Forecast, Third Quarter 2026
Release Date: September 2026
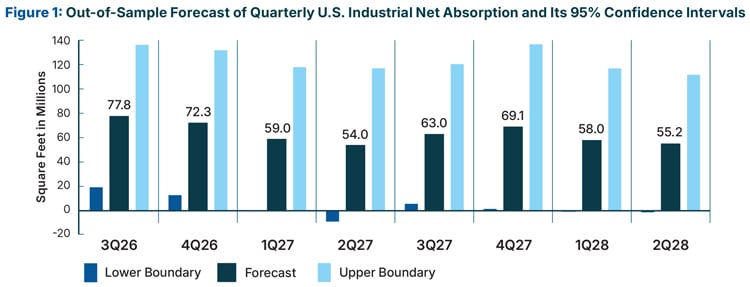
U.S. industrial net absorption in the first half of 2026 totaled 114.3 million square feet, a quarterly average of 57.1 million square feet that closely matches the 57.9 million-square-foot average quarterly pace recorded from 2023 through 2025, according to historical data provided by CoStar Group. Continued growth in consumer spending, e-commerce and capital expenditures is supporting moderate growth in demand for industrial space despite elevated interest rates and inflation due to the conflict with Iran. Given these trends, the Commercial Real Estate Development Association Industrial Space Demand Forecast projects 150.1 million square feet of net absorption across the U.S. in the second half of 2026 and 245.1 million square feet of absorption in 2027 (see Figure 1 for quarterly projections). This forecast assumes a resolution to the conflict with Iran and a return to normal trade and shipping activity in the near future. A more prolonged conflict could result in higher inflation and interest rates, limiting economic growth and demand for industrial space.
Industrial Markets
Demand for industrial space continues to be supported by resilient consumer spending and steady growth in e-commerce. Retail sales excluding gasoline stations rose 4.4% year over year in July.1 E-commerce sales grew 12.2% year over year in the second quarter, and its share of total retail sales climbed to a record high of 17.1%, up from 16.3% a year earlier.2 Broader growth in retail and wholesale sales volume is also supporting demand for industrial real estate. Combined retailer and wholesaler sales rose 10.8% year over year in June, while combined inventories grew 3.7% over the same period.3 In addition, increasingly aggressive capital expenditures on data centers are supporting demand for industrial space to service the sector’s growing supply chain.
On the supply side, net deliveries of industrial space in the first half of 2026 averaged just 75.0 million square feet per quarter, the lowest level since early 2018, as higher interest rates and construction costs have reduced the number of development projects that are financially viable. However, the construction pipeline appears to have stabilized, with square footage under construction rising 5% year over year to 595 million square feet. Deliveries in the first half of the year exceeded absorption by just 35.6 million square feet, causing a slight increase in the vacancy rate, to 6.9% from 6.8% at year-end 2025. Asking rents grew 1.79% year over year, consistent with a stable market.
Economic Trends
U.S. economic growth remained slow but stable through the first half of 2026, with gross domestic product (GDP) growing at an annualized rate of 2.1% in the first quarter and 1.5% in the second quarter.4 While this represents a slow pace of growth by historical standards, it is steadier than in 2025, when trade and tariff activity drove large swings in GDP. Consumer spending and net investment have been the primary drivers keeping GDP positive; both correlate closely with demand for industrial space and help explain the market’s recent stability. The Federal Reserve Bank of Atlanta’s GDP Now is forecasting third quarter growth of 4.0%, reflecting an anticipated reduction in the trade deficit and inventory drawdowns that weighed on the second quarter reading, as well as an acceleration in consumer spending and net business and residential investment.5 It should be noted that economic models provide limited guidance into when or how the conflict with Iran will conclude. A protracted war could significantly impact the economy before the year ends.
The Federal Reserve recently signaled potential rate increases by the end of 2026, a reversal from earlier predictions of further rate cuts. Core Consumer Price Index inflation (excluding food and energy) rose 2.5% for the 12 months ending in July, a slight decrease from 2.6% in June, though still above the Fed’s 2% target. The energy index, by contrast, rose 14.7% year over year on a 24.6% jump in gasoline prices.6 Higher energy costs have yet to result in a measurable increase in core inflation, but the longer they remain elevated, the more likely they are to spill over into rising prices for other goods and services. A swift resumption of oil shipments through the Strait of Hormuz, contingent on a resolution of the conflict with Iran, is likely needed to keep inflation contained and avoid further tightening by the Fed.
Beyond price stability, the Fed has a mandate to maintain full employment, and recent data point to a cooling labor market. Data from the Bureau of Labor Statistics show a significant softening in the rate of hiring, with July posting a surprise loss of 23,000 jobs, while the unemployment rate fell to 4.1% as people left the labor market.7 The Fed may respond to the combination of a softening labor market and above-target core inflation by holding rates steady, making further rate increases far from a foregone conclusion. The 10-year U.S. Treasury yield has climbed sharply since the start of the year, from 4.16% at year-end 2025 to 4.70% as of Aug. 20, reaching a 20-month high of 4.75% earlier in the month. New industrial projects and leasing activity have both grown modestly in the first half of the year despite the increase in rates, suggesting that current interest rates are not likely to pose a greater challenge in 2026 than in recent years.
The Forecast Model
The authors use various explanatory variables in the forecast’s statistical model, including lagged net absorption, real GDP growth, inflation and output gaps, monetary policy, and seasonal effects. Historical data from CoStar Group was used to apply an exponential smoothing technique to remove seasonality.
This quarter’s forecast reflects a substantial expansion of that framework. Rather than a single estimation technique, the model now draws on eight complementary statistical techniques. These include three Kalman filter models that track the market’s underlying trend and the strength of its economic relationships; a Markov switching model that allows demand to behave differently in calm versus turbulent periods; two regression specifications, one static and one incorporating the market’s recent momentum; a univariate time series model; and a cointegration model linking occupied industrial space to industrial production. Each technique is back-tested across 35 rolling historical periods spanning 2015 through 2024, and the eight resulting forecasts are combined using historically optimal, horizon-specific weights, an approach that improved on the accuracy of the forecast when compared with every individual technique on its own.
The forecast draws on a broad range of underlying data beyond historical net absorption. These include two composite pressure indices (one capturing COVID-era supply-chain disruption, the other geopolitical and war-related shocks) along with a model-based recession probability indicator. These are combined with standard macroeconomic drivers (GDP growth, inflation, unemployment and the Federal Funds Rate), industrial output and structural demand measures (industrial production, e-commerce’s share of retail sales, and inventory-to-sales ratios), and real estate–specific market fundamentals (vacancy, deliveries, space under construction and asking rents).
The forecast for industrial absorption for the second half of 2026 is 150.1 million square feet, with lower and upper boundaries of 32.1 and 268.0 million square feet, respectively. The predicted full-year net absorption for 2027 is 245.1 million square feet, with lower and upper boundaries of -1.6 and 492.0 million square feet, respectively. By comparison, full-year net absorption was 635.0 million square feet in 2022, 290.4 million square feet in 2023, 213.9 million square feet in 2024 and 190.8 million square feet in 2025.
Actual Versus Forecast
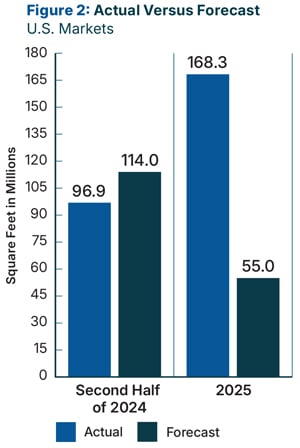
Figure 2 compares actual net absorption in 2025 to what the forecast had projected for the year. In 2025, 168.3 million square feet of industrial space was absorbed, compared with the forecast of 55 million square feet. The comparison of the forecast’s projection to actual 2026 net absorption will be provided in the First Quarter 2027 Industrial Space Demand Forecast.
Key Inputs and Disclaimers
The predictive model is funded by the CREDA Research Foundation and was developed by Hany Guirguis, Ph.D., and Randy Anderson, Ph.D., formerly of the University of Central Florida. Guirguis substantially revised the model in 2026. The model, which forecasts demand for industrial space at the national level, uses variables that span the entire supply chain and drive demand for space, enabling it to capture most changes in demand.
While leading economic indicators have been able to forecast recessions and expansions, the indices used in this study are constructed to forecast industrial real estate demand expansions, peaks, declines and troughs. The Industrial Space Demand model was originally developed using the Kalman filter approach, in which the regression parameters are allowed to vary over time and are thus more appropriate for an unstable industrial real estate market; that approach now forms part of a broader eight-model composite methodology.
The forecast is based on a process that tests more than 40 economic and real estate variables that are theoretically related to the demand for industrial space, including measures of employment; GDP; exports and imports; and air, rail and shipping data. Leading indicators that factor heavily into the model include the Federal Reserve Board’s Index of Manufacturing Output (IMO), the Purchasing Managers Index (PMI) from the Institute for Supply Management (ISM), and historical net absorption data provided by CoStar Group. Historical industrial real estate market data are provided by CoStar Group, which assumes no responsibility for this forecast. The dataset used for the forecast includes all industrial and flex industrial properties in the 390 largest U.S. markets tracked by CoStar Group, regardless of property size or owner occupancy status. Net absorption and other real estate market data identified in this report may vary when compared with other datasets.
Authors
Hany Guirguis, Ph.D., Professor, Economics and Finance, Manhattan University
Joshua Harris, Ph.D., Academic Director, Fordham Real Estate Institute, Fordham University
Media Inquiries
Please contact Brielle Scott, director of marketing and communications, at bscott@credaglobal.org.
Disclaimer
This project is intended to provide information and insights to industry practitioners and does not constitute advice or recommendations. The CREDA Research Foundation disclaims any liability for actions taken as a result of this project and its findings.
© 2026 Commercial Real Estate Development Association Research Foundation
There are many ways to give to the Foundation and support projects and initiatives that advance the commercial real estate industry. If you would like to contribute to the Foundation, please contact Christopher Ware, vice president of partnerships and strategic initiatives, at 703-674-1419 or cware@credaglobal.org.
Endnotes
1 U.S. Census Bureau, “Advance Monthly Sales for Retail and Food Services,” news release, August 14, 2026, https://www.census.gov/retail/sales.html.
2 U.S. Census Bureau, “Quarterly Retail E-Commerce Sales,” news release, August 18, 2026, https://www.census.gov/retail/ecommerce.html.
3 U.S. Census Bureau, “Manufacturing and Trade Inventories and Sales,” news release, August 14, 2026, https://www.census.gov/mtis/current/index.html.
4 U.S. Bureau of Economic Analysis, “GDP (Advance Estimate), 2nd Quarter 2026,” news release, July 30, 2026, https://bea.gov/news/2026/gdp-advance-estimate-2nd-quarter-2026.
5 Federal Reserve Bank of Atlanta, “GDPNow,” accessed August 19, 2026, https://www.atlantafed.org/research-and-data/data/gdpnow.
6 U.S. Bureau of Labor Statistics, “Consumer Price Index,” Economic News Release, August 12, 2026, https://www.bls.gov/news.release/cpi.toc.htm.
7 U.S. Bureau of Labor Statistics, The Employment Situation: July 2026, USDL-26-1291, August 7, 2026, https://www.bls.gov/news.release/pdf/empsit.pdf.