
State and metro employment figures can help spot labor market shifts if viewed in the proper context.
With construction workers seemingly in short supply, developers naturally want to know if there are enough workers in their area to execute a project on time. While there are no guarantees, data from the Bureau of Labor Statistics (BLS) can offer a clue.
Each month, typically two weeks after posting national employment data, BLS posts two figures for every state and Washington, D.C.: seasonally adjusted employment and not seasonally adjusted employment. Seasonal adjustment is a widely used statistical method to account for regularly occurring variations due to weather, school opening dates or other events that can affect when contractors begin or finish some types of projects. Thus, changes in seasonally adjusted employment levels are more likely to reveal underlying trends related to economic activity.
Both types of data are best compared year over year, not month to month. Extremely mild or challenging weather (such as hurricanes or extended periods of frozen or snow-covered ground) can distort the normal variation from one month to the preceding or succeeding month. The ramping up or winding down of a particularly large project in a given month can also produce a misleading picture, especially in places with typically low levels of employment.
The map below provides a snapshot of the change in construction employment from June 2025 to June 2026. Over this period, 33 states (plus Washington, D.C.) realized growth in construction employment, while 14 states experienced negative construction job growth and three states remained unchanged. While these particular months may have anomalous changes in employment, similar maps from other recent months generally indicate that the same pattern held in most states. For instance, from May 2025 to May 2026, 33 states had increases in construction employment, and 17 (plus Washington, D.C.) had decreases. Moreover, most states posted gains (or losses) in both May and June. The handful of states that changed generally had minimal losses (or gains) in the previous period.
Of course, for projects located close to another state’s population center, there may be workers willing to cross state lines. Thus, it is useful to look beyond the borders of a single state to get an idea of available workers — or of a magnet that may pull workers away.
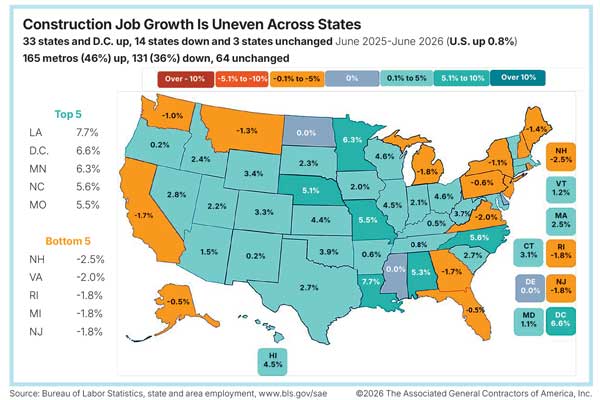
Furthermore, knowing that employment is increasing or decreasing statewide in a state as spread out as Florida, Texas or California does not reveal much about the availability of workers locally. Fortunately, BLS also posts construction employment data for some 360 metro areas, including separate divisions of 13 large metros. (For about 80% of these areas, as well as for Delaware, Hawaii and Washington, D.C., BLS posts only combined mining, logging, and construction totals, but in nearly all cases, construction accounts for virtually the entire combined total.)
The Associated General Contractors of America posts rankings of all states, Washington, D.C., and the 360 metro areas by both numeric and percentage change over the latest 12 months at agc.org/learn/construction-data/construction-data-employment. (BLS does not seasonally adjust metro data, making year-over-year comparisons of the same month or group of months the only meaningful way to interpret changes in employment levels.)
California provides an illustration of why metro data is important. While the state had a decline of 12,700 construction employees between June 2025 and June 2026 and five of its areas were among the 10 metros with the largest losses, the San Jose-Sunnyvale-Santa Clara metro added 4,200 jobs in that span.
In short, BLS data can be helpful in learning where construction activity is growing or weakening. However, there are a couple of caveats to keep in mind. Initial estimates are sometimes revised in the subsequent two reports and again with the release of January numbers the following year. Also, the figures for most states are not broken out between residential and nonresidential construction or between building firms and heavy and civil engineering construction firms, which mainly do nonbuilding projects. As with any data source, these figures provide a useful benchmark, not a foolproof guide.
Ken Simonson is the chief economist with the Associated General Contractors of America. Contact him at ken.simonson@agc.org.